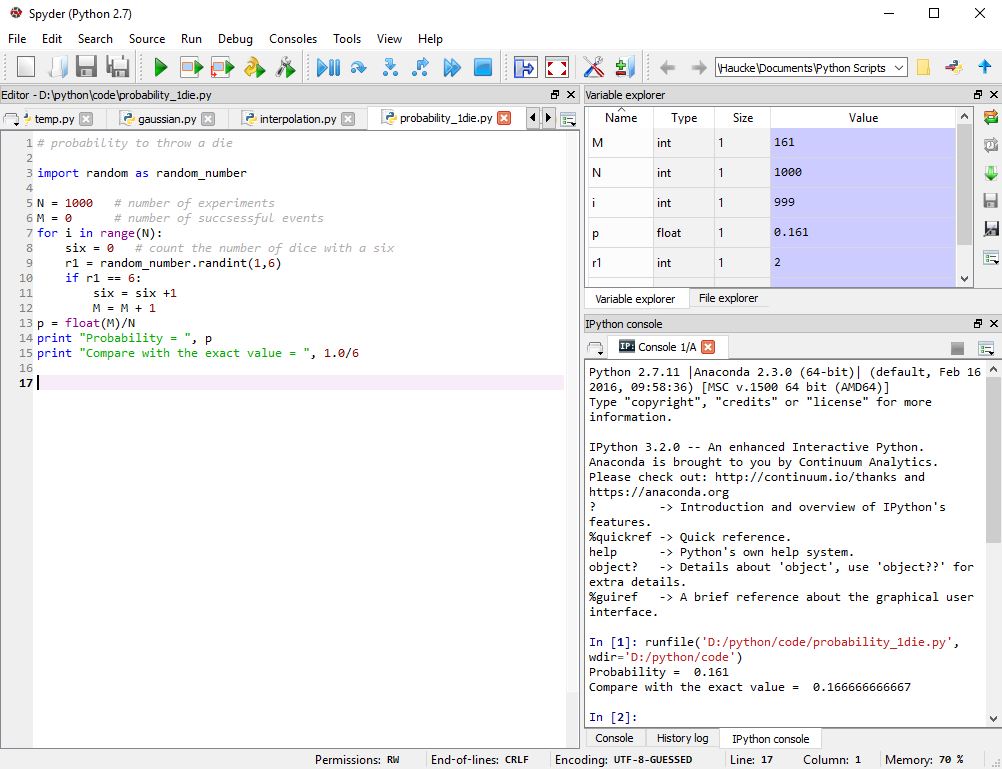
Zur Ausführung von Python-Code benötigt man ein Pythonprogramm (Python27 oder Python34). Sehr empfehlenswert ist "Anaconda"
mit "Spyder":

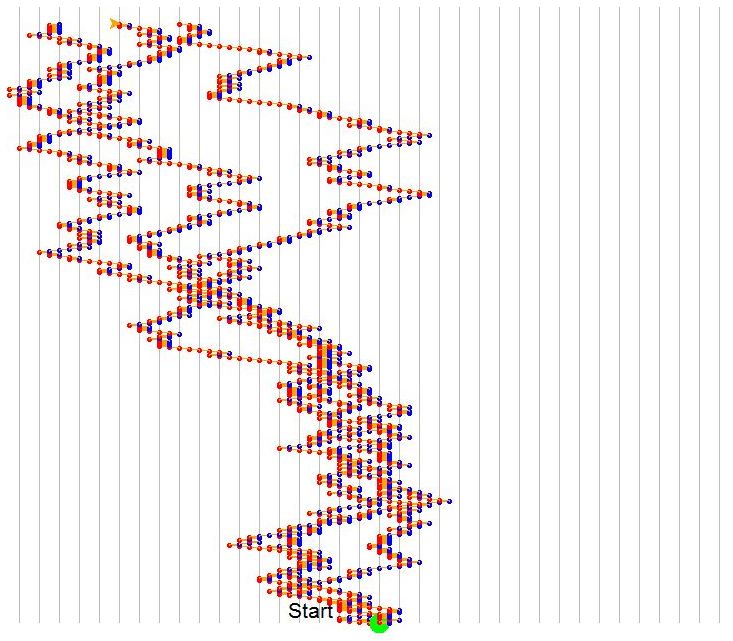
Um den "Random Walk" grafisch darzustellen, kann man den Turtle-Modul benutzen. Dieses funktioniert wie ein xy-Schreiber.
Die "Schildkröte" bewegt sich schrittweise vorwärts, rückwärts, nach links oder nach rechts.
Die Besonderheit der Python-Programmierung ist, dass der Zeileneinzug (Indention) eine Rolle spielt. Falls man den Code
aus der Website kopiert, müssen die Zeilen ohne Einzug am Beginn der Zeile stehen!
Der Python-File kann aber hier heruntergeladen werden:
random_walk_1d_turtle.py
				  # 1d_random_walk_turtle


				  import turtle

				  import random


				  # grid

				  turtle.color("gray")

				  turtle.speed(10)

				  x = -360

				  for j in range(37):

				    turtle.up()

				    turtle.setpos(x,320)

				    turtle.right(90)

				    turtle.down()

				    turtle.forward(640)

				    turtle.up()

				    x = x + 20

				    turtle.left(90)


				  def flip():

				    # returns +1 or -1, randomly

				    i = random.randint(0,1)

				      if i == 0:

					        return -1

				      else:

					        return 1


				  turtle.color("black")

				  turtle.setpos(-90,-320)

				  turtle.write("Start", font=("Arial",16,"normal"))


				  for k in range(3):   # 3x a turtle

					    turtle.speed(1)

					    turtle.up()

					    turtle.setpos(0,-320)

					    turtle.color("orange")

					    turtle.down()

					    turtle.dot(20, "green")


				  for i in range(600):

					    if flip() == 1:

						      turtle.forward(10)

						      turtle.dot(5, "blue")

					    else:

						      turtle.backward(10)

						      turtle.dot(5, "red")


						    turtle.sety(1 + turtle.ycor())  # move in y-coordinate; set y one step higher


				  turtle.done()

				  print "End"

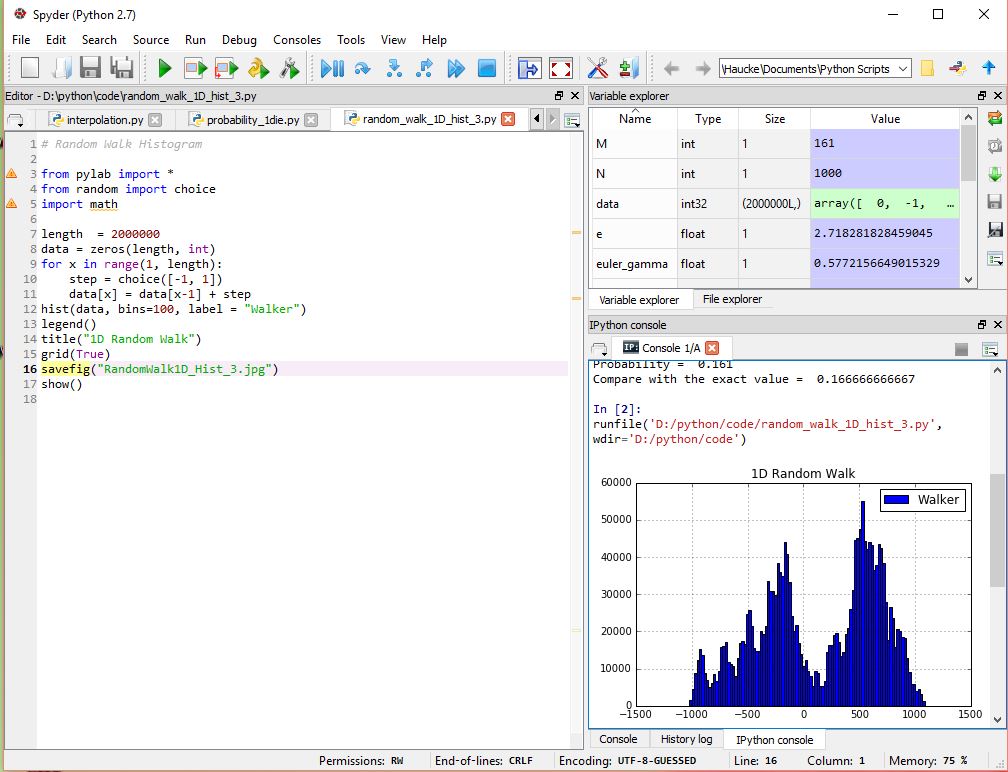
Python-Code für einen 1D Random Walk mit der Ausgabe als Histogramm in der Spyder-IDE:

The logistic map is a polynomial mapping (equivalently, recurrence relation) of degree 2, often cited as an
archetypal example of how complex, chaotic behaviour can arise from very simple non-linear dynamical
equations. The map was popularized in a seminal 1976 paper by the biologist Robert May, in part as a
discrete-time demographic model analogous to the logistic equation first created by Pierre Francois
Verhulst. Mathematically, the logistic map is written
xn+1 = r * xn * (1-xn)
where:
xn is a number between zero and one, and represents the ratio of existing population to the
maximum possible population at year n, and hence x0 represents the initial ratio of population to max.
population (at year 0)
r is a positive number, and represents a combined rate for reproduction and starvation.
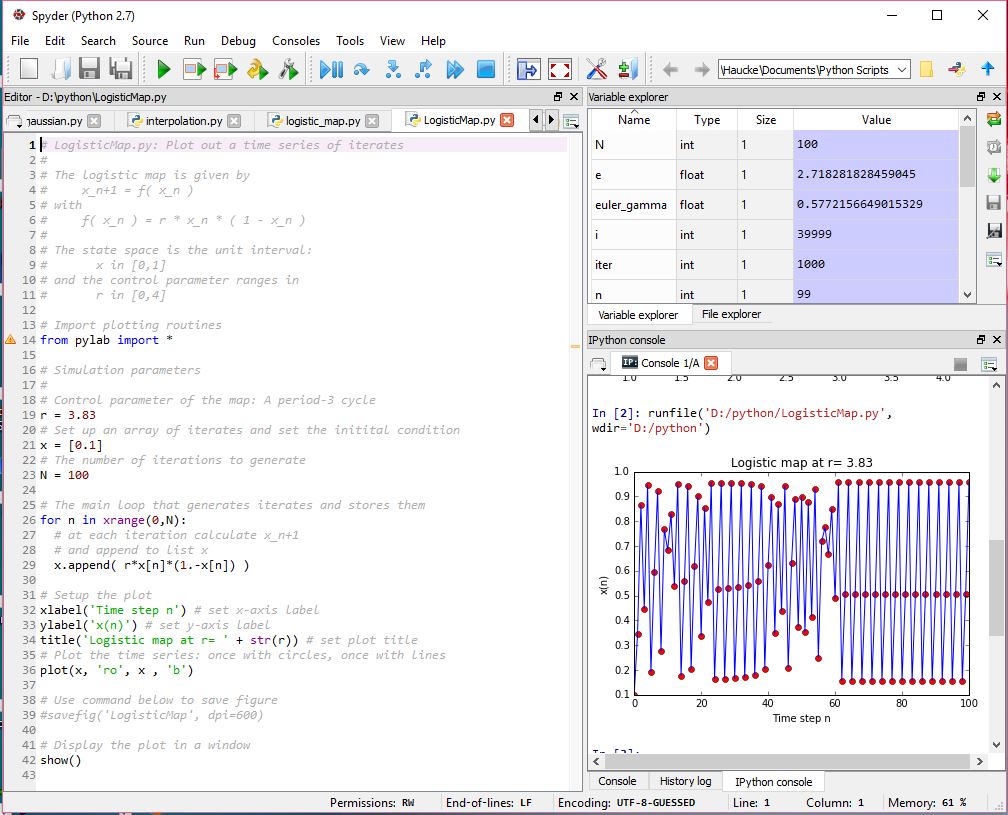
Python-Code für die "Logistic Map" in der Spyder-IDE:
